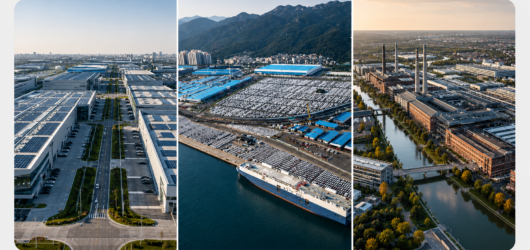
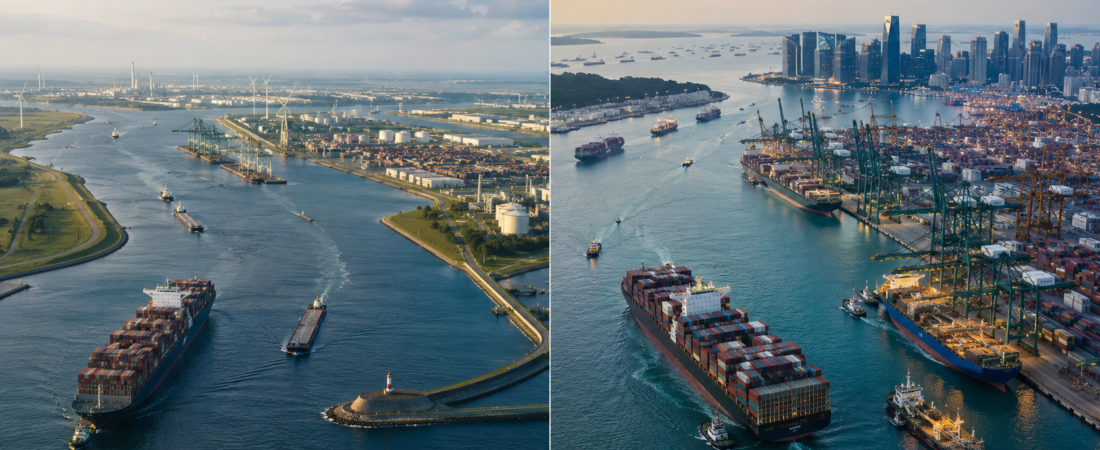
Rotterdam and Singapore are global ports built around different spatial problems. Rotterdam is a North Sea gateway that links ocean shipping to the Rhine–Meuse basin and continental Europe. Singapore is an island hub at the junction of major Asian sea routes, built around transshipment, bunkering and maritime services. Rotterdam moves cargo between sea and continent; Singapore switches it between ships and supports the business of shipping.
Geography and nautical access
Rotterdam occupies a long corridor in the Rhine–Meuse delta. Its port and industrial area extends for more than 40 kilometres from the city towards the North Sea, with direct access through the Nieuwe Waterweg and no sea locks. The corridor combines deep-water terminals near the coast with inland terminals, storage, pipelines and heavy industry farther east.
Singapore sits beside the Singapore Strait, where east–west routes through the Malacca and Singapore Straits meet regional services. Access depends on intensive traffic management as much as depth: MPA monitors vessel movements through its Vessel Traffic Information System and the STRAITREP reporting scheme. Pasir Panjang and Tuas have facilities designed for vessels with draughts of up to 23 metres.
Rotterdam is a lock-free sea–river gateway. Singapore is a tightly managed straits hub.
Historical formation and modern development
Rotterdam did not begin with the Nieuwe Waterweg. A settlement developed around the dam in the Rotte from about 1250, and the port grew inside the city through trade across the Rhine–Meuse delta and the North Sea. For much of the nineteenth century, cargo was still handled manually in urban quays. The port then began a sustained movement westward as ships grew and industrial cargoes demanded more space.
The opening of the Nieuwe Waterweg in 1872 gave Rotterdam a more reliable route to the North Sea and strengthened its connection to the industrialising Ruhr through the Rhine. New docks crossed to the south bank: Rijnhaven was built in 1887–93 and Maashaven in 1898–1905. Petroleum facilities followed at Pernis in the interwar years; Botlek and Europoort extended the port after 1945. Each phase placed larger terminals closer to the sea and separated more port activity from the historic city.
Containerisation accelerated the same shift. Europe Container Terminals was established in 1966, the first Maasvlakte opened in 1973 and Maasvlakte 2 entered service in 2013. Rotterdam’s history is therefore a sequence of access improvements, industrial expansion and westward reclamation—not a story that starts in 1864.
Singapore’s modern port grew from an older entrepôt geography. After Raffles established a free port in 1819, the Singapore River and Boat Quay became the core of a colonial trading system that redistributed goods between China, Southeast Asia, India and Europe. New Harbour—later Keppel Harbour—added a natural deep-water anchorage, docks, repair and coaling facilities for steamships during the nineteenth century.
After independence, port geography shifted from river trade and colonial dockyards to specialised terminals. Singapore decided in 1966 to build Southeast Asia’s first container terminal, began construction at Tanjong Pagar in 1968 and received its first container ship, MV Nihon, in 1972. Standard boxes sharply reduced transfer time between ship and land transport. By investing before regular Europe–Southeast Asia container services were established, Singapore gained the capacity to aggregate regional cargo as global liner networks expanded. Containerisation therefore reinforced, rather than created, its hub role.
Expansion moved west from Tanjong Pagar and Keppel to Brani, Pasir Panjang and now Tuas. Land scarcity made consolidation decisive. Moving city terminals to Tuas releases about 1,000 hectares and 30 kilometres of southern waterfront for urban redevelopment, while a single large terminal reduces inter-terminal transfers and supports automation at scale.
Spatial layout and land use
Rotterdam covers about 125 km², including more than 60 km² of industrial sites. Its elongated layout contains old city docks, distribution parks, refineries, chemical plants, tank farms, pipelines and deep-water terminals. Maasvlakte 2 expanded the port’s surface by about 20 per cent and placed its newest container terminals directly on the North Sea.
Singapore’s working port is split among the City Terminals, Pasir Panjang, Jurong and Tuas. PSA’s container system currently has 56 berths and designed annual capacity of 46.5 million TEU. Tuas will consolidate container handling on a 13.37 km² site with 66 berths and capacity of 65 million TEU when completed in the 2040s.
The area figures are not equivalent. Rotterdam’s 125 km² includes an entire port-industrial complex; Singapore’s 13.37 km² covers the future Tuas terminal. The useful comparison is spatial form: Rotterdam is a mature delta corridor, while Singapore is concentrating a dispersed urban port in one automated western hub.
Port functions and cargo
Rotterdam combines three functions: European gateway, industrial production centre and energy port. Containers feed inland distribution, while crude oil, petroleum products, chemicals, dry bulk and liquefied gas support refineries, chemical plants, storage and processing. Cargo is not merely transferred; a large share enters an industrial system that exchanges feedstocks, heat, steam, gases and utilities.
Singapore’s core function is maritime relay. About 85 per cent of containers handled by PSA are transshipped, and the same vessel concentration sustains bunkering, ship supply, repair, finance, insurance, broking and legal services. Jurong Port provides a separate base for conventional and bulk cargo, including cement, steel products, project cargo and industrial materials.
Scale and performance
Rotterdam handled 428.4 million tonnes of cargo and 14.2 million TEU in 2025. Total tonnage fell 1.7 per cent, while container volume rose 3.1 per cent. The figures show the scale of its mixed bulk, container and industrial gateway rather than container dominance.
Singapore handled 44.66 million TEU in 2025—more than three times Rotterdam’s container volume. Vessel arrivals reached 3.22 billion gross tonnes, while marine-fuel sales reached 56.77 million tonnes. The latest published total-cargo figure is 622.67 million tonnes in 2024.
Throughput measures output, not operational productivity. Comparable crane moves per hour, berth occupancy and vessel turnaround figures are not published consistently for both ports. The defensible numerical comparison is therefore scale: Rotterdam leads as a diversified tonnage and industrial gateway; Singapore leads decisively in container throughput, transshipment and bunkering.
Maritime and inland connectivity
Rotterdam advertises more than 500 deep-sea, short-sea, feeder and roll-on/roll-off liner connections to over 1,000 ports. On land, it connects to three core Trans-European Transport Network corridors—the Rhine–Alpine, North Sea–Mediterranean and North Sea–Baltic corridors—and distributes cargo by inland barge, rail, road and pipeline. Its strength is the number and variety of routes into the European hinterland.
Singapore is connected by about 200 shipping lines to more than 600 ports. In June 2026 it ranked third in UNCTAD’s monthly Liner Shipping Connectivity Index, behind China and the Republic of Korea. Its strength is route intersection: dense mainline and feeder services allow cargo to be switched between ships without entering a large national hinterland.
Rotterdam’s network is maritime-to-inland. Singapore’s is maritime-to-maritime. Published service counts use different institutional methods, so they indicate reach rather than a precise productivity ranking.
Industrial and maritime-service clusters
Rotterdam’s cluster is physically concentrated inside the port. More than 120 industrial companies operate there, including five refineries and more than 40 chemical producers. Shared tank storage, pipelines, gases, heat, steam, wastewater treatment and electricity create direct production links between neighbouring firms.
Singapore’s cluster extends across the city-state. More than 200 international shipping groups are present, supported by ship management, finance, insurance, law, broking, technology and logistics. Tuas also connects the port to the Jurong and Tuas industrial districts, so the new terminal links a global services centre to a western manufacturing and innovation belt.
Governance and strategy
The Port of Rotterdam Authority is a non-listed public company operating a landlord-port model. It develops the port and industrial area, leases sites and manages safe shipping. The Municipality of Rotterdam owns 70.83 per cent and the Dutch state 29.17 per cent.
Singapore separates public authority from terminal operation. MPA is the regulator, planner, maritime-industry promoter and national representative; PSA operates the principal container terminals. This arrangement connects land planning, navigation, bunkering standards, digitalisation and decarbonisation at national scale.
Climate change and environmental responsibility
Most of Rotterdam’s port lies outside the main dyke system. Sea-level rise raises flood risk, while extreme rainfall, heat, drought, lower river levels and salt-water intrusion can disrupt terminals, navigation, freshwater supply and industry. The authority uses area-specific adaptation strategies rather than one uniform defence.
Rotterdam’s climate transition plan targets a climate-neutral port area by 2050 through new energy infrastructure, lower-carbon fuels, electrification and carbon capture. Progress is uneven: industrial-cluster emissions rose 11 per cent to 21.2 million tonnes of CO₂-equivalent in 2025, mainly because electricity generation increased. Porthos, the carbon-transport and offshore-storage project, is now expected to start no earlier than the second half of 2027. Environmental responsibility also extends beyond carbon: Maasvlakte 2 was paired with nature compensation and measures intended to protect surrounding habitats.
Singapore faces sea-level rise, storm surge, stronger winds and intense rainfall. Tuas was built five metres above mean sea level, and MPA identifies flooding, operational disruption and higher maintenance costs as material climate risks.
MPA’s Decarbonisation Blueprint covers port terminals, harbour craft, future marine fuels, bunkering standards, the Singapore registry, research, carbon accounting and green finance. Tuas and Jurong Port are targeted for net-zero emissions by 2050; electric automated vehicles, smart-grid systems and solar power reduce terminal emissions. Tuas Phase 1 also included the relocation of more than 2,300 coral colonies, showing that port responsibility includes biodiversity as well as carbon.
Rotterdam must decarbonise and defend a large fossil-fuel and industrial complex. Singapore must protect a compact transshipment hub while changing the fuels used by ships that it neither owns nor controls. Both have credible programmes; neither has completed the transition.
Conclusion
Rotterdam and Singapore are not interchangeable “top ports”. Rotterdam’s 125 km² port-industrial footprint is far larger than the planned 13.37 km² Tuas terminal and is more deeply connected to inland markets. Singapore handles more than three times as many containers, dominates transshipment and bunkering, and supports a broader maritime-services economy.
Their histories explain the difference. Rotterdam advanced west along a delta as access channels, industrial land and ship size expanded. Singapore converted a nineteenth-century entrepôt into an early container hub, then used land-scarcity pressure to justify consolidation at Tuas. Climate change now exposes both models: Rotterdam must transform a carbon-intensive industrial corridor, while Singapore must raise, automate and decarbonise a compact maritime relay.
References
- Jurong Port. (2026). What can the bulk cargo berths handle? Source
- Maritime and Port Authority of Singapore. (2018). Singapore Nautilus: The container revolution. Source
- Maritime and Port Authority of Singapore. (2020). The development of Maritime Singapore. Source
- Maritime and Port Authority of Singapore. (2022). Sea Transport Industry Transformation Map 2025. Source
- Maritime and Port Authority of Singapore. (2023a). Sustainability Report 2023. Source
- Maritime and Port Authority of Singapore. (2023b). Tuas Port Phase 1 awards. Source
- Maritime and Port Authority of Singapore. (2025). Strong growth momentum for Maritime Singapore. Source
- Maritime and Port Authority of Singapore. (2026a). Vessel Traffic Information System. Source
- Maritime and Port Authority of Singapore. (2026b). Port of the Future. Source
- Maritime and Port Authority of Singapore. (2026c). Singapore posts record port performance in 2025. Source
- Maritime and Port Authority of Singapore. (2026d). Global hub port. Source
- Maritime and Port Authority of Singapore. (2026e). Address at the International Association of Maritime Economists Conference. Source
- Maritime and Port Authority of Singapore. (2026f). Who we are. Source
- Maritime and Port Authority of Singapore. (2026g). MPA’s milestones. Source
- Maritime and Port Authority of Singapore. (2026h). Maritime Singapore Decarbonisation Blueprint. Source
- National Heritage Board. (2026a). The Singapore River Story. Source
- National Heritage Board. (2026b). The Story of Keppel Bay. Source
- Port of Rotterdam. (2019). De geschiedenis van de Rotterdamse haven in vogelvlucht. Source
- Port of Rotterdam. (2024). Construction of the Maasvlakte Zuid rail yard. Source
- Port of Rotterdam. (2026a). Facts and figures. Source
- Port of Rotterdam. (2026b). The port that will take you ahead. Source
- Port of Rotterdam. (2026c). Process industry. Source
- Port of Rotterdam. (2026d). Throughput in the port of Rotterdam shows slight decline. Source
- Port of Rotterdam. (2026e). Industry and energy. Source
- Port of Rotterdam. (2026f). Climate adaptation. Source
- Port of Rotterdam. (2026g). Flood risk management. Source
- Port of Rotterdam. (2026h). Climate Transition Plan for the port area and Port of Rotterdam Authority. Source
- Port of Rotterdam. (2026i). CO₂e emissions in Rotterdam port area rose in 2025. Source
- Port of Rotterdam. (2026j). Rotterdam Mainport Development Project. Source
- Port of Rotterdam Authority. (2026). Annual Report 2025: Highlights. Source
- Porthos. (2026). Schedule for the Porthos CO₂ transport and storage project revised. Source
- PSA Singapore. (2026a). Port. Source
- PSA Singapore. (2026b). Our story. Source
- United Nations Conference on Trade and Development. (2026). Liner shipping connectivity. Source
- Urban Redevelopment Authority. (2025a). Vibrant city living for all. Source
- Urban Redevelopment Authority. (2025b). Future-ready sustainable economic hub. Source